Data Profiling and Tags: What Is This Dataset, and What's Actually In It?
Data catalogs don't stay small. New datasets appear weekly, often across multiple teams, tools, and transformation layers. And somewhere in that growth, someone opens a table called orders_final and faces two questions at once: what is this dataset, and what's actually in it?
They're not the same question. This week, we shipped answers to both.
Data Profiling
Before you build a pipeline on top of a new dataset, before you connect it to a dashboard, before you hand it to a model, someone needs to understand the shape of the data. What the distributions look like. Which columns have gaps. Whether the values actually make sense.
Usually that means writing exploratory queries. Or asking whoever ingested it.
Data Profiling skips that entirely. Open any dataset or view and you get an automatic visual analysis, no query required. Categorical columns show value distribution as histograms and pie charts. Numeric columns show statistical metrics: average, standard deviation, min, max.
A data engineer connecting a new source can validate it in seconds. An analyst inheriting a dataset from another team doesn't need to ask what the status column contains, they can see that 71% of rows are active, 22% are pending, and 7% is something unexpected that probably warrants a conversation before anyone builds on top of it.
The profiling runs on your actual data, inside your project. You just open the tab and see it.
Tag
Data Profiling tells you what's in a dataset. Tags tell you what it is.
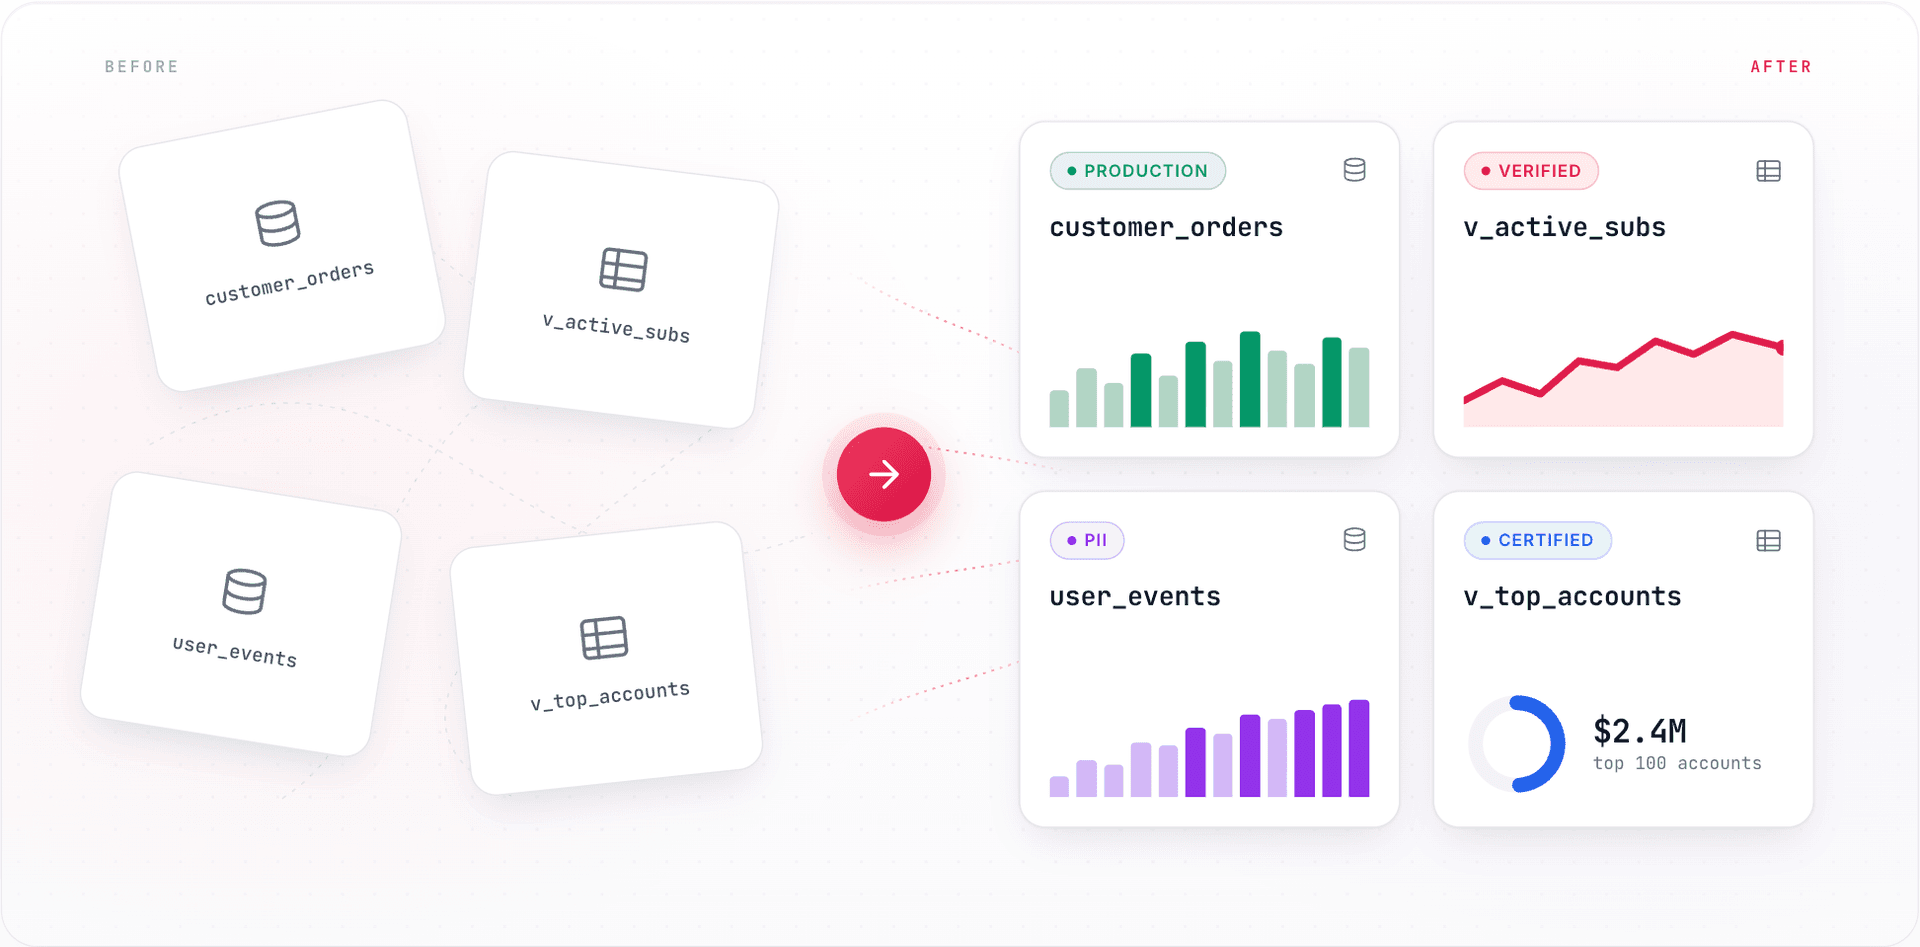
Tag any asset, datasets, views, notebooks, pipelines, with labels your whole organization shares: production, verified, sensitive, deprecated. Tags are searchable and filterable across the entire catalog, so the right dataset is always one filter away, not three Slack messages.
How to use both
For Data Profiling, open any dataset or view and go to the Profile tab. Datazone analyzes it automatically.
For Tags, click the tag field on any asset detail panel, type your label, done. Tags are immediately available as filters across the catalog.

Still chasing data across tools and teams?
Datazone unifies your data workflows — faster, clearer, smarter.
Get Started – It’s Free