What We Learned Building a Legal Intelligence Studio POC
Last week was different for us. We stepped into a world we don't usually work in, legal. A law firm reached out for a POC, and honestly, it made us rethink everything about how data connects across different industries. This week's focus: Legal Intelligence Studio POC. Here's what we learned building a graph-based case management system for lawyers.
The challenge
The firm came to us with a familiar problem, just in a new context. Hundreds of case files. Thousands of documents. Evidence scattered everywhere. They were spending hours manually connecting the dots: which cases share the same judge? Which attorney handled similar precedents? Where are the geographical patterns?
Sound familiar? It's the same story we hear in supply chain, finance, healthcare. Just different players.
What we built
We built them a connected intelligence platform. Every case, document, evidence piece, attorney, judge, and location mapped as nodes in a graph. The relationships? Automatic.
How it works
- Connect Everything — Pulled their case files from existing systems. Documents, court records, emails, everything flows into one place.
- Let the Graph Build Itself — Our system scans documents and identifies entities automatically. Cases link to evidence. Evidence connects to locations. Judges tie to attorneys. The graph just... builds itself.
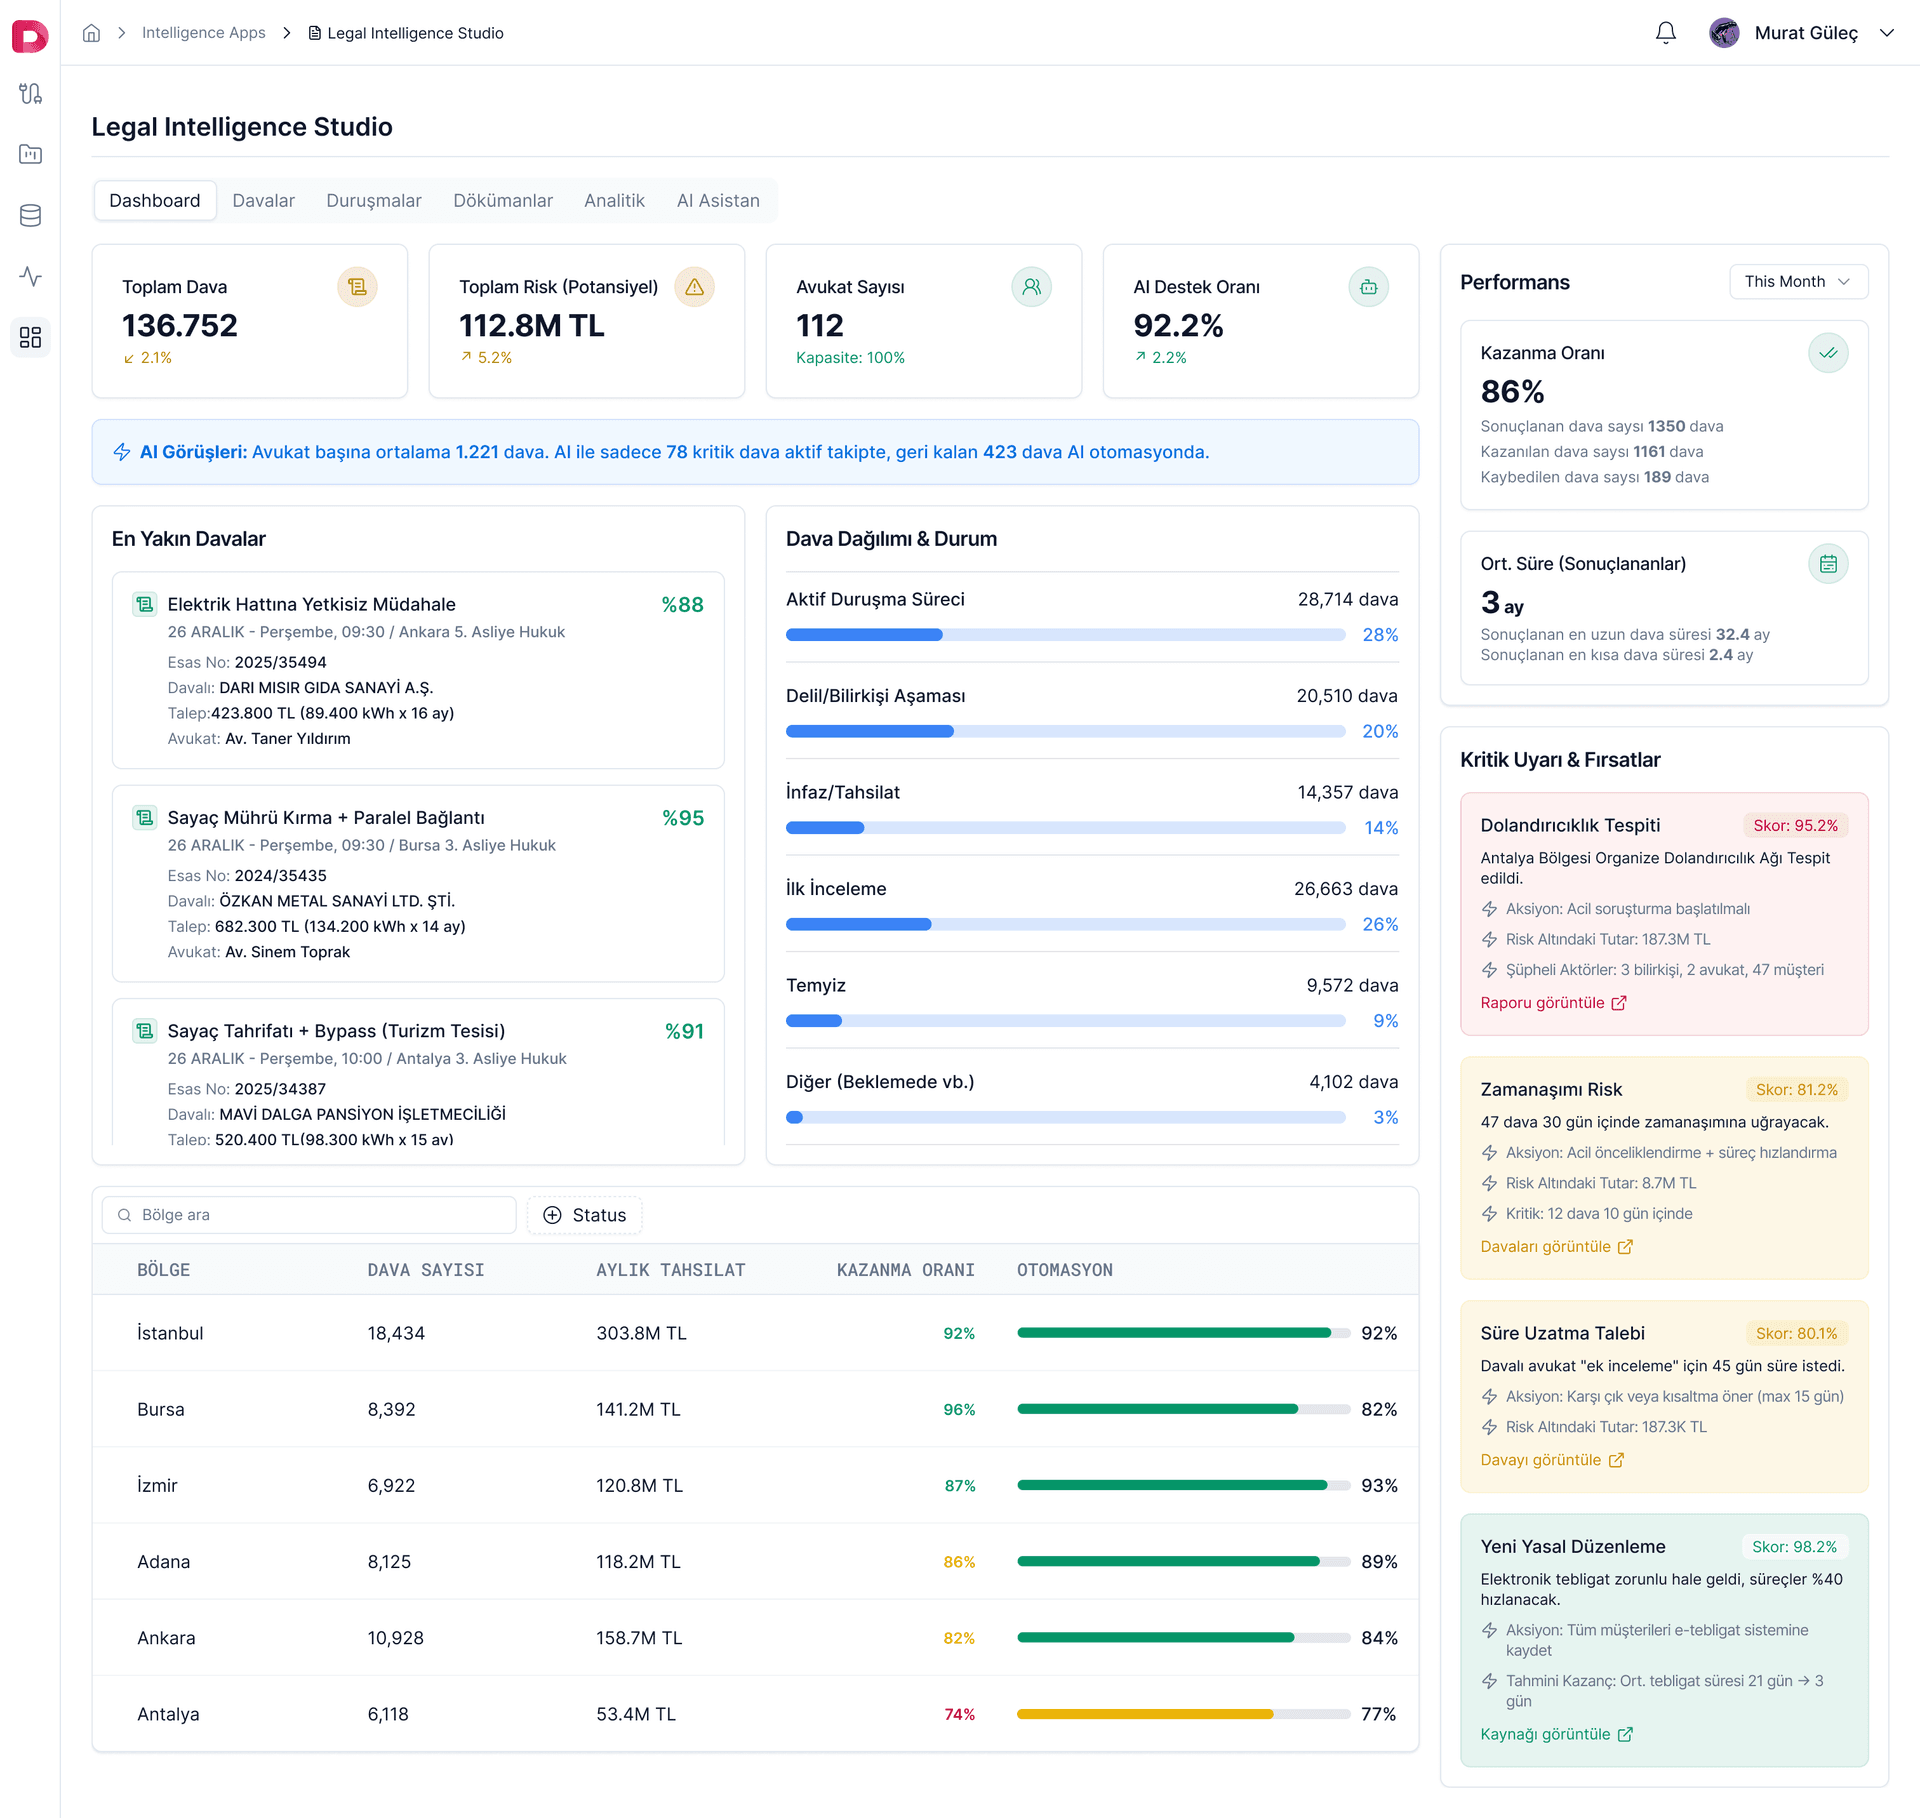
- See Like an Investigator — They wanted to work like fraud investigators do: see patterns, spot connections, identify risks visually. So that's what we gave them. Interactive graph, real-time filtering, drill-down capabilities.
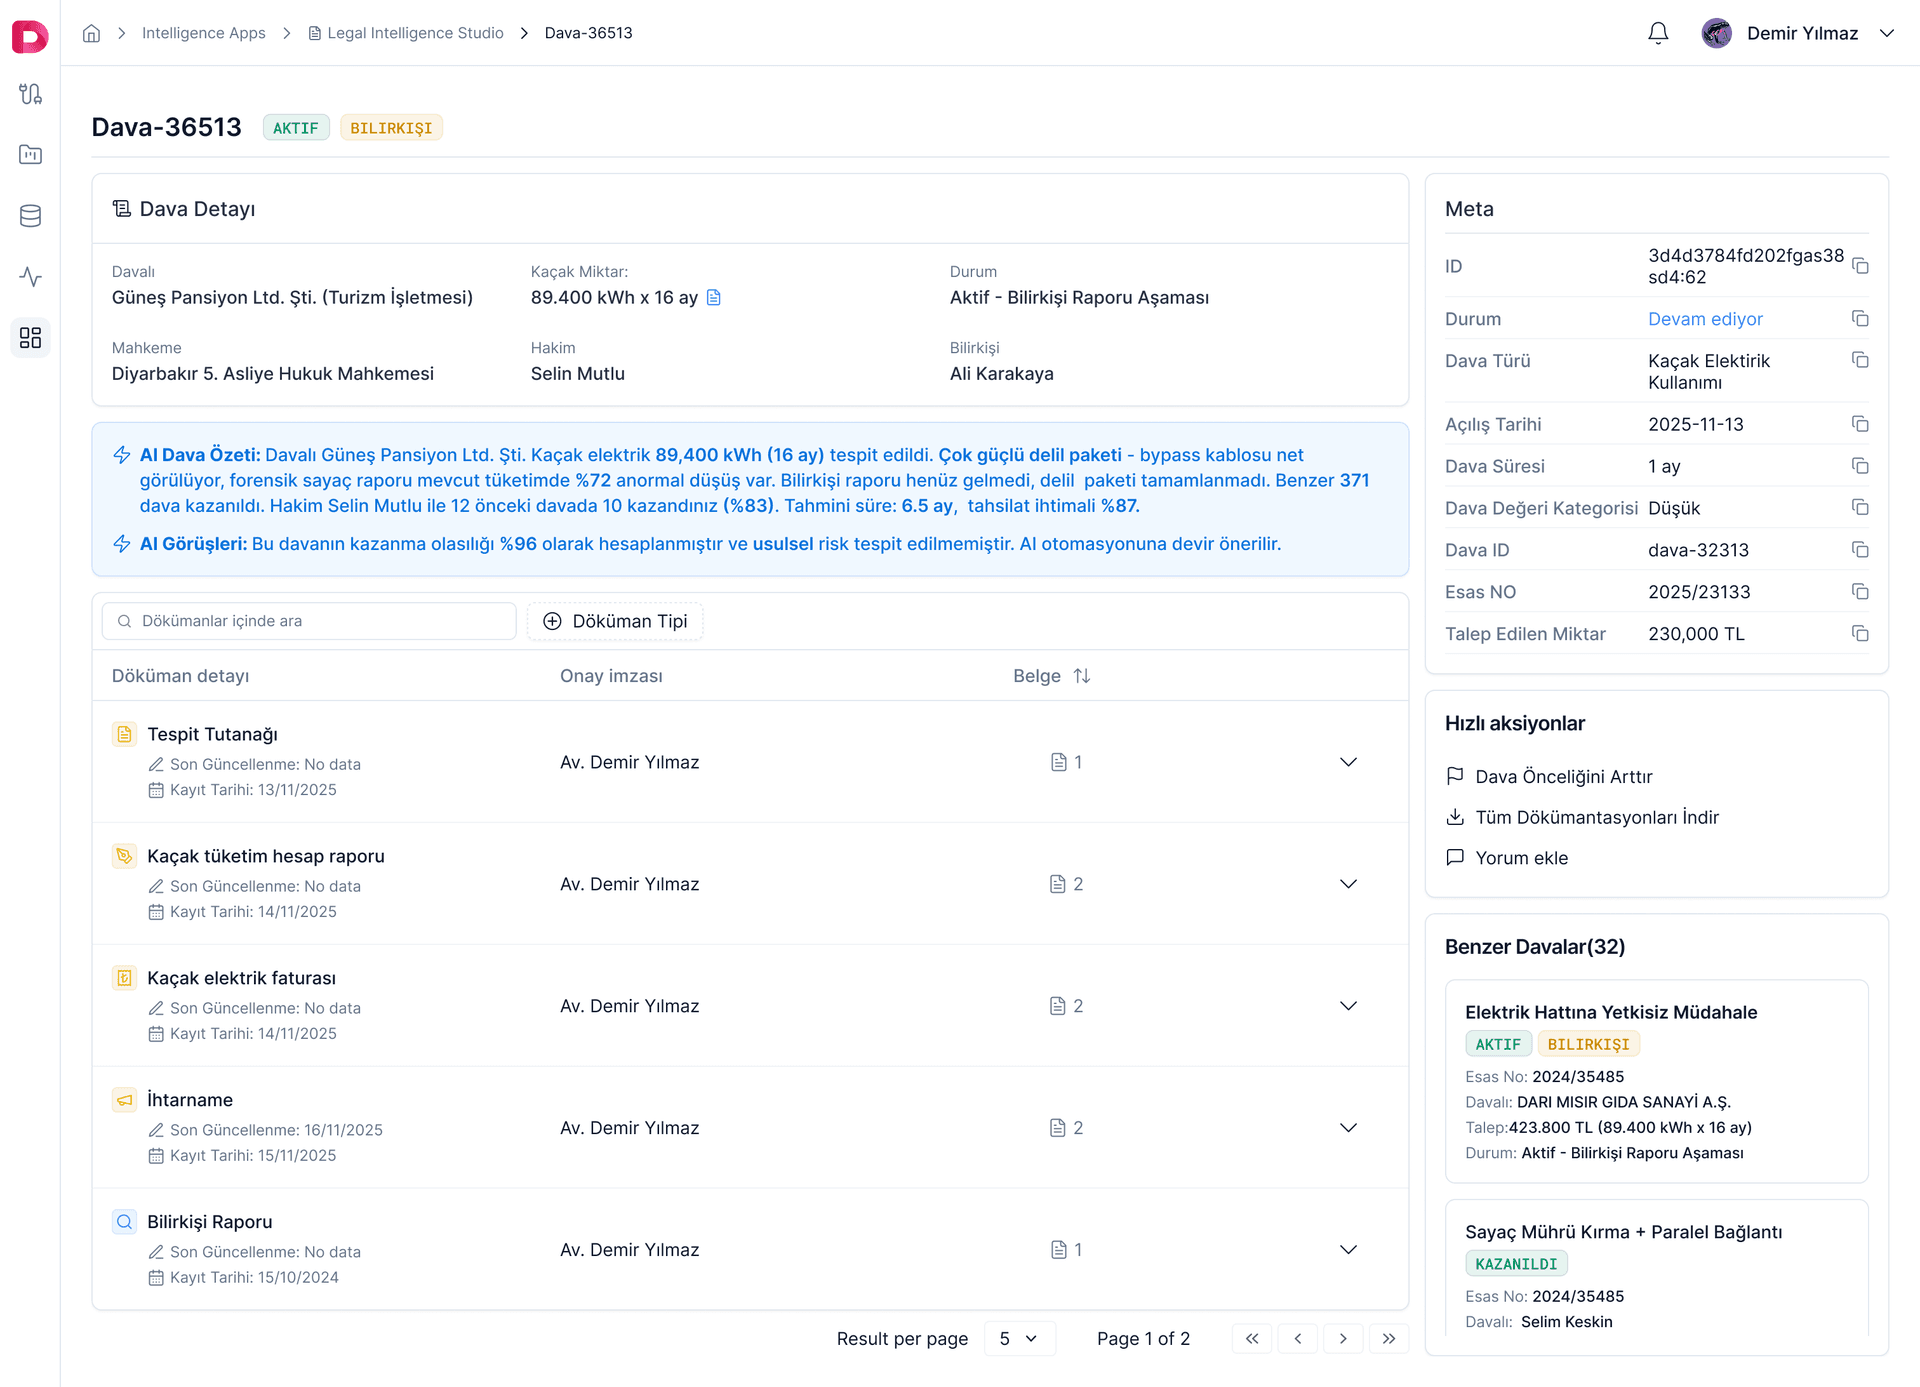
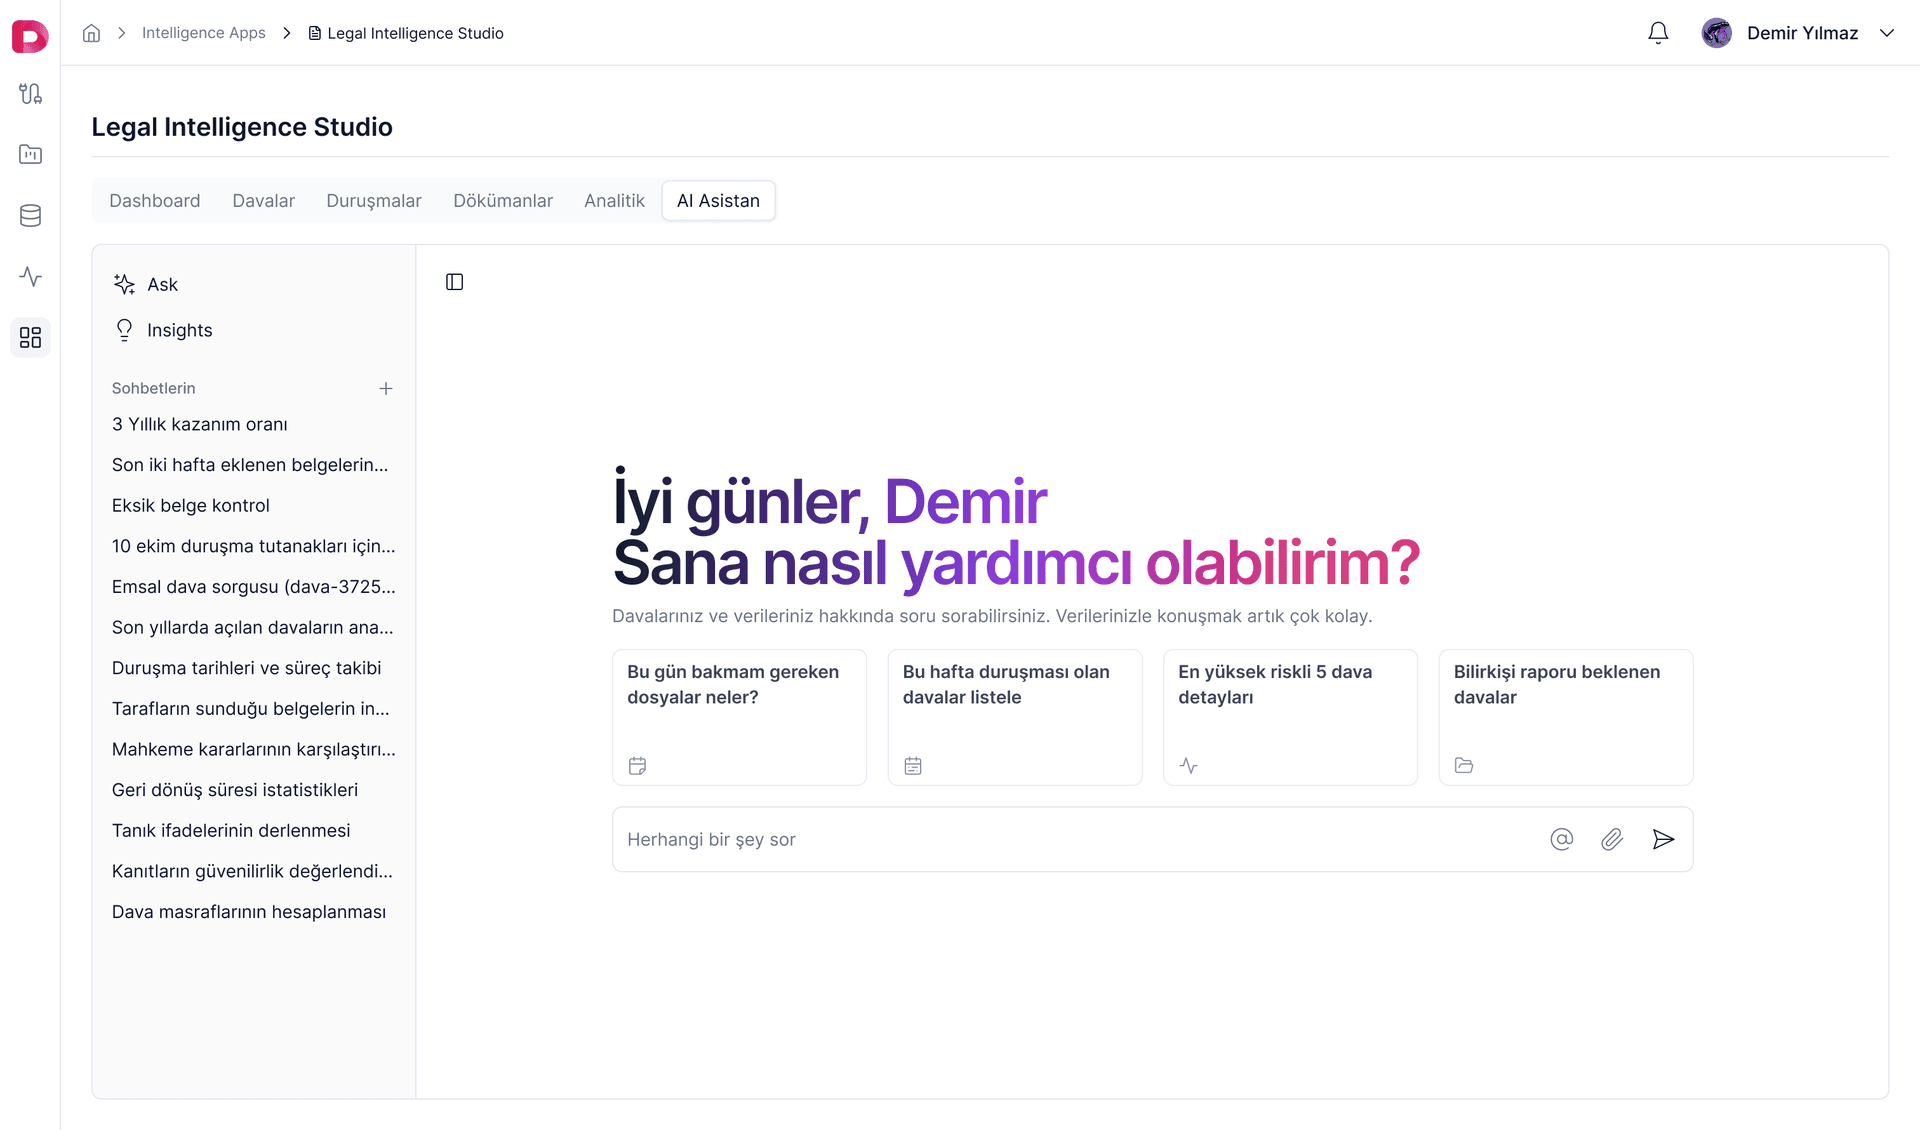
- Track What Matters — Dashboard shows 136,752 cases, 112.8M TL in exposure, win rates, distribution by region. The AI Assistant flags critical patterns: 1,221 new cases, 78 needing immediate attention, 423 ready for automation.
The interesting part
Building this POC made something click for us. We realized we weren't building a "Legal Intelligence Studio." We were building a connected data intelligence layer that happened to be solving a legal problem this time. The pattern is universal:
- Entities (cases, products, transactions, patients)
- Relationships (who, what, where, when)
- Intelligence (patterns, risks, opportunities)
Next week it could be supply chain nodes and logistics routes. Next month, financial transactions and suspicious patterns. Same platform, different context.
What this means
Datazone's graph database isn't just for data engineers anymore. It's infrastructure for anyone dealing with connected information. Law firms tracking cases. Manufacturers tracking supply chains. Banks tracking transactions. Healthcare systems tracking patient journeys.
If your data has relationships that matter, we can turn it into visual intelligence. No custom development, just declarative configuration, and let the graph do its thing.
The takeaway
This POC taught us that every industry is fighting the same battle: making sense of connected data. They just call it different things.
Lawyers call it case management. Supply chain folks call it network optimization. Finance teams call it transaction monitoring.
We just call it connected intelligence.

Still chasing data across tools and teams?
Datazone unifies your data workflows — faster, clearer, smarter.
Get Started – It’s Free